
TECHNICAL EXPLAINER
9 MIN READ
Google Ads Quality Score Explained: What It Is and How to Improve It
An advertiser running a single Search campaign notices something odd in their keyword report. One keyword shows a Quality Score of 8. Another, in the same ad group, targeting a closely related term, shows a 4. The ads are similar, and the landing page is the same. So why the gap?
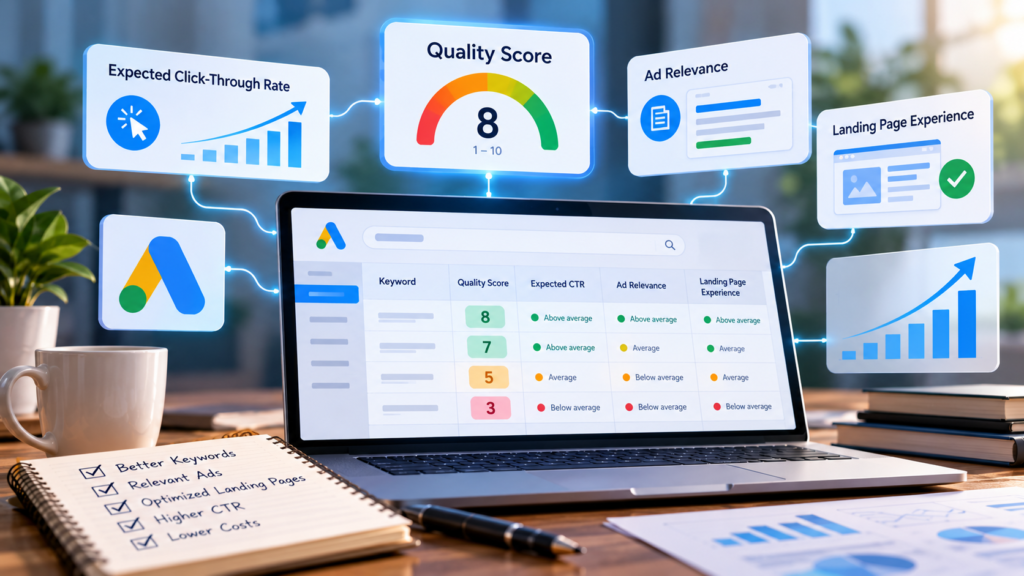
Quality Score can help advertisers identify weaknesses in the relationship between a keyword, the ad shown for it, and the landing page a click leads to. Used correctly, it is a diagnostic tool, not a complete measure of campaign success. It’s built from three components, expected click-through rate, ad relevance, and landing page experience, each with its own status rating, combining into the 1 to 10 score reported at the keyword level.
The goal isn’t to chase a perfect 10 on every keyword. It’s to build ads and landing pages relevant enough that they genuinely satisfy the person who searched, which also tends to support better performance over time.
What Is Google Ads Quality Score?
Google Ads Quality Score is a diagnostic rating, reported on a scale of 1 to 10 at the keyword level, intended to give advertisers a sense of how their ad quality compares to other advertisers. Google describes it as “a diagnostic tool meant to give you a sense of how well your ad quality compares to other advertisers” (Google Ads Help: About Quality Score for Search campaigns ↗).
The displayed score is based on three components: expected click-through rate (CTR), ad relevance, and landing page experience.
The number in your report is a summary for your benefit; the auction runs on real-time evaluations of the same three factors, recalculated for each search. That’s why advertisers get more value from the individual component ratings than from the overall number. The score tells you something is off. The components tell you where.
How Does Google Ads Quality Score Work?
Quality Score is reported for individual keywords in eligible Search campaigns. For each keyword, Google evaluates expected CTR, ad relevance, and landing page experience, and assigns each a status: typically “Above average,” “Average,” or “Below average.”
A “Below average” rating on ad relevance points you toward ad copy and ad group structure, while a “Below average” rating on landing page experience points you toward the destination page. The score is reported over time rather than recalculated fresh for every auction, and it’s most useful read alongside impressions, clicks, and cost per conversion, since a low score with strong conversions is a different problem than a low score with none.
The displayed score does not directly determine whether a specific ad appears for a specific search, or where it lands. Those outcomes depend on Ad Rank, covered further down, which draws on real-time quality signals, your bid, and the competitive context of that auction.
The Three Main Components of Quality Score
1. Expected Click-Through Rate
Expected CTR is Google’s estimate of how likely your ad is to be clicked for a given keyword, relative to other advertisers targeting similar terms, with position already factored in. It’s not simply “will people click this ad”; it’s an estimate adjusted for where the ad would typically appear.
Practical areas to review: align ad messaging directly with the keyword and intent behind it, write clear and specific headlines rather than vague ones, communicate a relevant benefit with an accurate call to action, review actual CTR in context since impressions and position shape what “good” looks like, and test meaningful ad variations rather than minor wording tweaks.
A high actual CTR does not automatically translate into an “Above average” expected CTR rating. Expected CTR is a forward-looking estimate, not a readout of historical clicks, so the two can diverge.
2. Ad Relevance
Ad relevance measures how closely your ad relates to the intent behind a search. This component is most often damaged by campaign structure problems rather than weak writing.
Common causes of a “Below average” rating include broad ad groups that lump together keywords with meaningfully different intents, generic ad copy that doesn’t address the specific search, and a mismatch between an ad group’s keyword themes and the message in its ads.
Improvements worth making: group closely related keywords together rather than mixing distinct themes for convenience, write ad copy that reflects the actual intent of that keyword group, and review the search terms report regularly to see what people are actually typing. Avoid splitting ad groups further when intent is already well aligned; it adds overhead without improving relevance. Campaign structure should support genuinely relevant experiences, not maximize the number of ad groups you manage.
3. Landing Page Experience
Landing page experience reflects how relevant and useful your landing page is likely to be for people who click your ad. Google’s recommendation captures the logic well: “Give people what they’re looking for. If someone searches for ‘flannel shirts’ and clicks your ad for ‘flannel shirts,’ the landing page they go to should feature your flannel inventory” (Google Ads Help: 5 ways to use Quality Score to improve your performance ↗).
Factors worth reviewing: relevance between the search, the ad clicked, and the landing page; clear, specific, original content rather than thin or duplicated text; easy navigation, mobile usability, and loading performance; and transparency about the business with a clear next step for the visitor.
A landing page should deliver on exactly what the ad promised and help the visitor complete the task that brought them there. Review the whole journey, search, ad, landing page, rather than treating page speed alone as the deciding factor.
How to Check Your Google Ads Quality Score
- Sign in to Google Ads.
- Open the relevant Search campaign and navigate to its keywords.
- Locate the column settings for the keywords table.
- Add the Quality Score column, and where available, the component columns for expected CTR, ad relevance, and landing page experience.
- Review ratings for individual keywords, not just the campaign as a whole.
- Identify keywords with “Below average” ratings and investigate the likely cause for each.
Interface labels and columns can change as Google updates the platform, so confirm current names directly in your account. A low rating should prompt investigation, not an automatic pause: a keyword that matters to the business and converts well, even with a mediocre score, is usually worth improving rather than cutting.
What Is a Good Google Ads Quality Score?
Quality Score runs from 1 to 10. Lower scores often point to real room for improvement in relevance or landing page experience, middle-range scores suggest some elements are working while others could improve, and higher scores indicate stronger ratings across all three components, though a high score does not guarantee a profitable campaign.
Some advertisers treat a score of 7 or above as “good.” This is a practical rule of thumb circulating in the industry, not an official Google threshold; what counts as meaningful depends on the keyword, search intent, competition, and business context. A keyword with a high Quality Score can still produce poor results if the traffic it attracts isn’t genuinely relevant or doesn’t convert, since a high score describes the diagnostic health of the ad experience, not whether that traffic is valuable to the business.
How to Improve Google Ads Quality Score Step by Step
Step 1: Identify the keywords that need attention. Review scores and component ratings, and prioritize by business value, not just the lowest numbers. A low-spend keyword at a 3 deserves less attention than a high-value keyword at a 5.
Step 2: Improve keyword-to-ad alignment. Check whether the ad addresses the intent behind the specific keyword. Refine headlines and descriptions to communicate the relevant benefit clearly, and avoid promises the landing page can’t back up.
Step 3: Refine ad group structure where necessary. Separate distinct intents into their own ad groups only when doing so will support more relevant ads and landing pages, not as a reflex to try to game the score.
Step 4: Improve the landing page. Make sure it matches what the ad promised, with clear content, mobile usability, loading performance, and an obvious call to action.
Step 5: Review search terms and exclude irrelevant traffic. Add negative keywords where queries don’t match what the business offers. Negative keywords control targeting and reduce wasted spend; they don’t directly raise Quality Score.
Step 6: Test and monitor changes. Make deliberate, documented changes rather than adjusting several variables at once. Updates don’t necessarily appear immediately, and there’s no reliable way to guarantee a specific timeline or result, so evaluate real outcomes, cost per acquisition and qualified conversions, alongside the diagnostic ratings.
Google Ads Quality Score vs. Ad Rank
This is one of the most commonly confused pairs of terms in Google Ads, so it’s worth being explicit.
| Factor | Quality Score | Ad Rank |
|---|---|---|
| Purpose | Diagnoses the relative quality of your ads and landing page experience | Determines whether an ad is eligible to show, and where it appears relative to other ads |
| Scale | Reported on a 1 to 10 scale | Calculated through Google’s real-time auction systems, not displayed as a 1 to 10 score |
| Main context | Keyword-level diagnostic reporting | Individual ad auctions, recalculated for each search |
| Inputs or components | Expected CTR, ad relevance, landing page experience | Your bid, real-time ad and landing page quality signals, Ad Rank thresholds, auction competitiveness, search context, and expected impact from ad assets |
| How advertisers use it | To identify areas worth improving | To understand ad eligibility and placement within a given auction |
| Direct relationship | Not itself a direct auction input | Draws on real-time versions of the same underlying quality concepts Quality Score reports on |
Google describes Ad Rank as “a set of values that are used to determine whether your ads are eligible to show and if eligible, where on the page your ads are shown,” calculated from your bid, the quality of your ads and landing page, Ad Rank thresholds, auction competitiveness, search context, and the expected impact of your ad assets (Google Ads Help: About Ad Rank ↗).
Improving ad and landing page relevance can support stronger real-time quality signals that feed into Ad Rank, but the displayed Quality Score number itself is not inserted directly into that calculation. It’s a report on the same underlying factors, not a component the auction consults, and it should not be described as the sole determinant of ad position or cost per click.
Does Quality Score Affect Cost Per Click?
This question causes more confusion than almost any other part of Google Ads. The displayed Quality Score is a diagnostic metric, not a direct input into the ad auction and not a pricing formula you can plug a number into.
The underlying quality signals, evaluated in real time for each auction, can influence Ad Rank, which in turn affects auction economics. Relevant ads and well-matched landing pages can contribute to more efficient advertising over time, but improving the visible score in your account does not guarantee a lower CPC on its own.
CPC also depends on factors outside Quality Score: bidding strategy, keyword competition, auction context, and how well campaigns convert. Serpistan’s own look at current Google Ads cost-per-click benchmarks shows how much CPC varies by industry, independent of any advertiser’s Quality Score. It’s generally more useful to evaluate cost per conversion and return on ad spend, since those numbers tell you whether the campaign is actually working.
Common Google Ads Quality Score Mistakes
Treating Quality Score as the main campaign KPI, rather than a diagnostic tool. Measure success against conversions and cost per acquisition instead.
Chasing 10 out of 10 on every keyword regardless of business value, instead of focusing effort on keywords that actually matter.
Adding keywords to ad copy unnaturally. Forced insertion rarely improves relevance and often makes ads read worse.
Creating excessive ad groups solely to manipulate scores, rather than letting structure follow genuine differences in intent.
Sending all ads to the homepage, when a generic landing page rarely matches a specific keyword’s intent.
Ignoring landing page usability beyond page speed. Speed matters, but it’s not the only factor Google is assessing.
Pausing valuable keywords based only on a low score, without investigating whether they still convert well despite it.
Confusing Quality Score with Ad Rank, which are related but distinct, as the comparison above lays out.
Assuming a higher score guarantees a lower CPC. The relationship is indirect, and CPC depends on several other factors too.
Making multiple changes without documenting their effects, which makes it hard to know which adjustment actually mattered.
Practical Example: Diagnosing a Low Quality Score
A business advertises a specific SEO service through a broad ad group containing several loosely related keywords, and sends every click to the same generic homepage.
Investigating each component: Is the ad specific and compelling for the exact search it’s showing against, or generic and reused across unrelated keywords (expected CTR)? Does the ad address the intent behind this particular keyword, or a broader offering (ad relevance)? Does the landing page provide what the ad promised and a clear next step, or does it leave the visitor to search the site themselves (landing page experience)?
| Problem Identified | Recommended Change | Intended Improvement |
|---|---|---|
| Broad ad group mixing several unrelated SEO-related keywords | Split into tighter ad groups organized by specific service or intent | More relevant ad copy becomes possible for each keyword group |
| Generic ad copy reused across the ad group | Write ad copy specific to each keyword group’s intent | Stronger alignment between search query and ad message |
| All traffic sent to the homepage | Build or select a landing page specific to the advertised service | Closer match between the ad’s promise and what the visitor finds |
No specific score increase or performance result is implied by this table. The point is the diagnostic process itself: identify which component is weak, investigate why, and make a targeted change rather than a broad, unfocused one.
How to Measure Success Beyond Quality Score
Optimization should aim to improve relevant traffic and real business results, not simply raise a diagnostic rating. Worth monitoring alongside Quality Score: actual click-through rate, conversion rate, cost per conversion, qualified leads or sales, conversion value and return on ad spend where tracked, and landing page engagement, with component ratings as a supporting diagnostic rather than the headline metric. A higher Quality Score does not automatically mean a campaign is more profitable, just as a lower one doesn’t mean it’s failing, so assess results over a meaningful period and account for seasonality and tracking accuracy.
Frequently Asked Questions
What is Google Ads Quality Score?
Google Ads Quality Score is a diagnostic rating, reported on a 1 to 10 scale at the keyword level, built from three components: expected click-through rate, ad relevance, and landing page experience. It helps advertisers identify where ads and landing pages may need improvement, rather than measuring campaign success directly.
What is a good Quality Score in Google Ads?
Quality Score runs from 1 to 10. Some advertisers treat 7 or above as a practical benchmark for “good,” but this is an informal rule of thumb, not an official Google threshold. What counts as meaningful depends on the keyword, competition, and business context behind it.
How can I improve my Google Ads Quality Score quickly?
Start by identifying the weakest component, expected CTR, ad relevance, or landing page experience, for your most important keywords, then address the underlying issue directly: tighter ad groups, more specific copy, or a more relevant landing page. There’s no reliable way to guarantee an immediate or specific improvement.
Does Quality Score affect CPC?
Not directly. The displayed score is a diagnostic metric. The real-time quality signals it summarizes can influence Ad Rank, which in turn affects auction economics, but improving your visible score does not guarantee a lower CPC on its own.
Is Quality Score calculated at the campaign or keyword level?
The standard, reported Quality Score is associated with individual keywords in eligible Search campaign reporting, not with the campaign as a whole.
Why is my Quality Score low even when my CTR is high?
Quality Score depends on three components, and CTR is only one of them. Expected CTR is also not identical to your actual, historical CTR; it’s a forward-looking estimate. Ad relevance and landing page experience may still need attention even when actual clicks look strong.
Does Quality Score affect ad position?
Not directly. Ad Rank determines auction eligibility and placement, using real-time quality signals, your bid, and auction context. The displayed Quality Score is a diagnostic summary rather than a direct input into that calculation.
Final Thoughts: Focus on the User Experience, Not Just the Score
Checking Quality Score regularly, investigating weak components, and making targeted improvements to keyword alignment, ad copy, and landing pages is a practical, repeatable process. What matters most isn’t the number itself. It’s the underlying experience: relevant keywords, ad messaging that genuinely matches what someone searched for, and landing pages that deliver on exactly what the ad promised. Quality Score works best as one diagnostic input within a broader PPC optimization process, not as the goal of it.
If you’re managing Google Ads campaigns and want a second look at how your keywords, ads, and landing pages line up, our PPC management services are worth exploring, or talk to our team about your current account structure.